How to Host Grafana for Free in 2026 (Complete Beginner's Guide)
Learn to host Grafana for free on MS Host. Visualize metrics, monitor infrastructure, manage observability without configuring servers. Deploy your own Grafana dashboard in minutes.

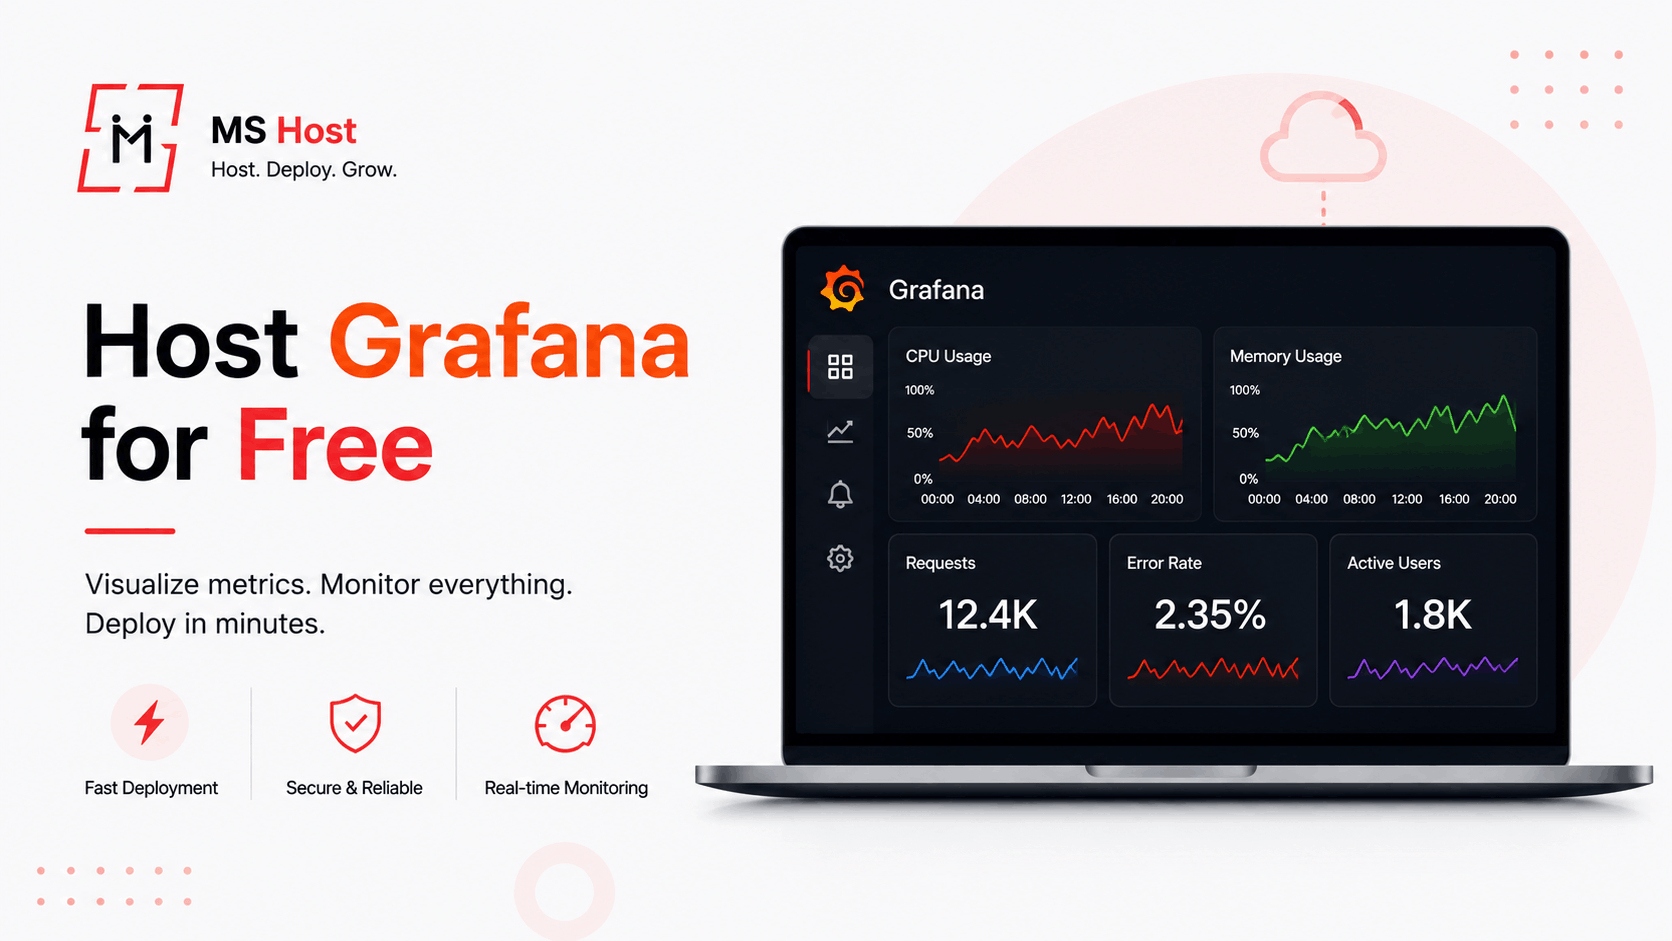
Learn how to host Grafana for free using MS Host. Deploy your own Grafana dashboard in minutes, monitor infrastructure, visualize metrics, and manage observability without configuring servers.
Introduction
Modern applications generate an enormous amount of operational data.
Whether you're running a personal website, backend API, Docker containers, or cloud infrastructure, monitoring that data is essential for maintaining performance and reliability.
That's where Grafana comes in.
Grafana is one of the world's most popular open-source visualization platforms. It transforms metrics, logs, and performance data into beautiful, interactive dashboards that help you understand what's happening across your systems.
While installing Grafana manually often requires configuring servers, Docker, networking, and updates, MS Host makes the process simple.
With MS Host, you can deploy Grafana in just a few clicks—no infrastructure management required.
In this guide, you'll learn how to deploy it for free using MS Host.
Why Developers Use Grafana
Grafana has become the industry standard for observability because it helps teams visualize everything from server health to application performance.
Developers use Grafana to:
- Monitor servers
- Track CPU and memory usage
- Visualize application metrics
- Create real-time dashboards
- Configure alerts
- Monitor cloud infrastructure
- Analyze performance trends
Everything is displayed in one centralized dashboard.
Why Host Grafana on MS Host?
Installing Grafana manually usually requires:
- Installing Linux
- Configuring Docker
- Managing storage
- Setting up networking
- Updating Grafana
- Configuring SSL
- Maintaining infrastructure
MS Host removes all of that complexity.
With MS Host, you get:
- Free hosting plan
- One-click deployment
- Managed infrastructure
- Custom domain support
- Runtime logs
- Deployment dashboard
- No server management
Instead of maintaining servers, you can focus on monitoring your applications.
Getting Started with MS Host
Step 1: Create an Account
Visit MS Host and click Get Started.
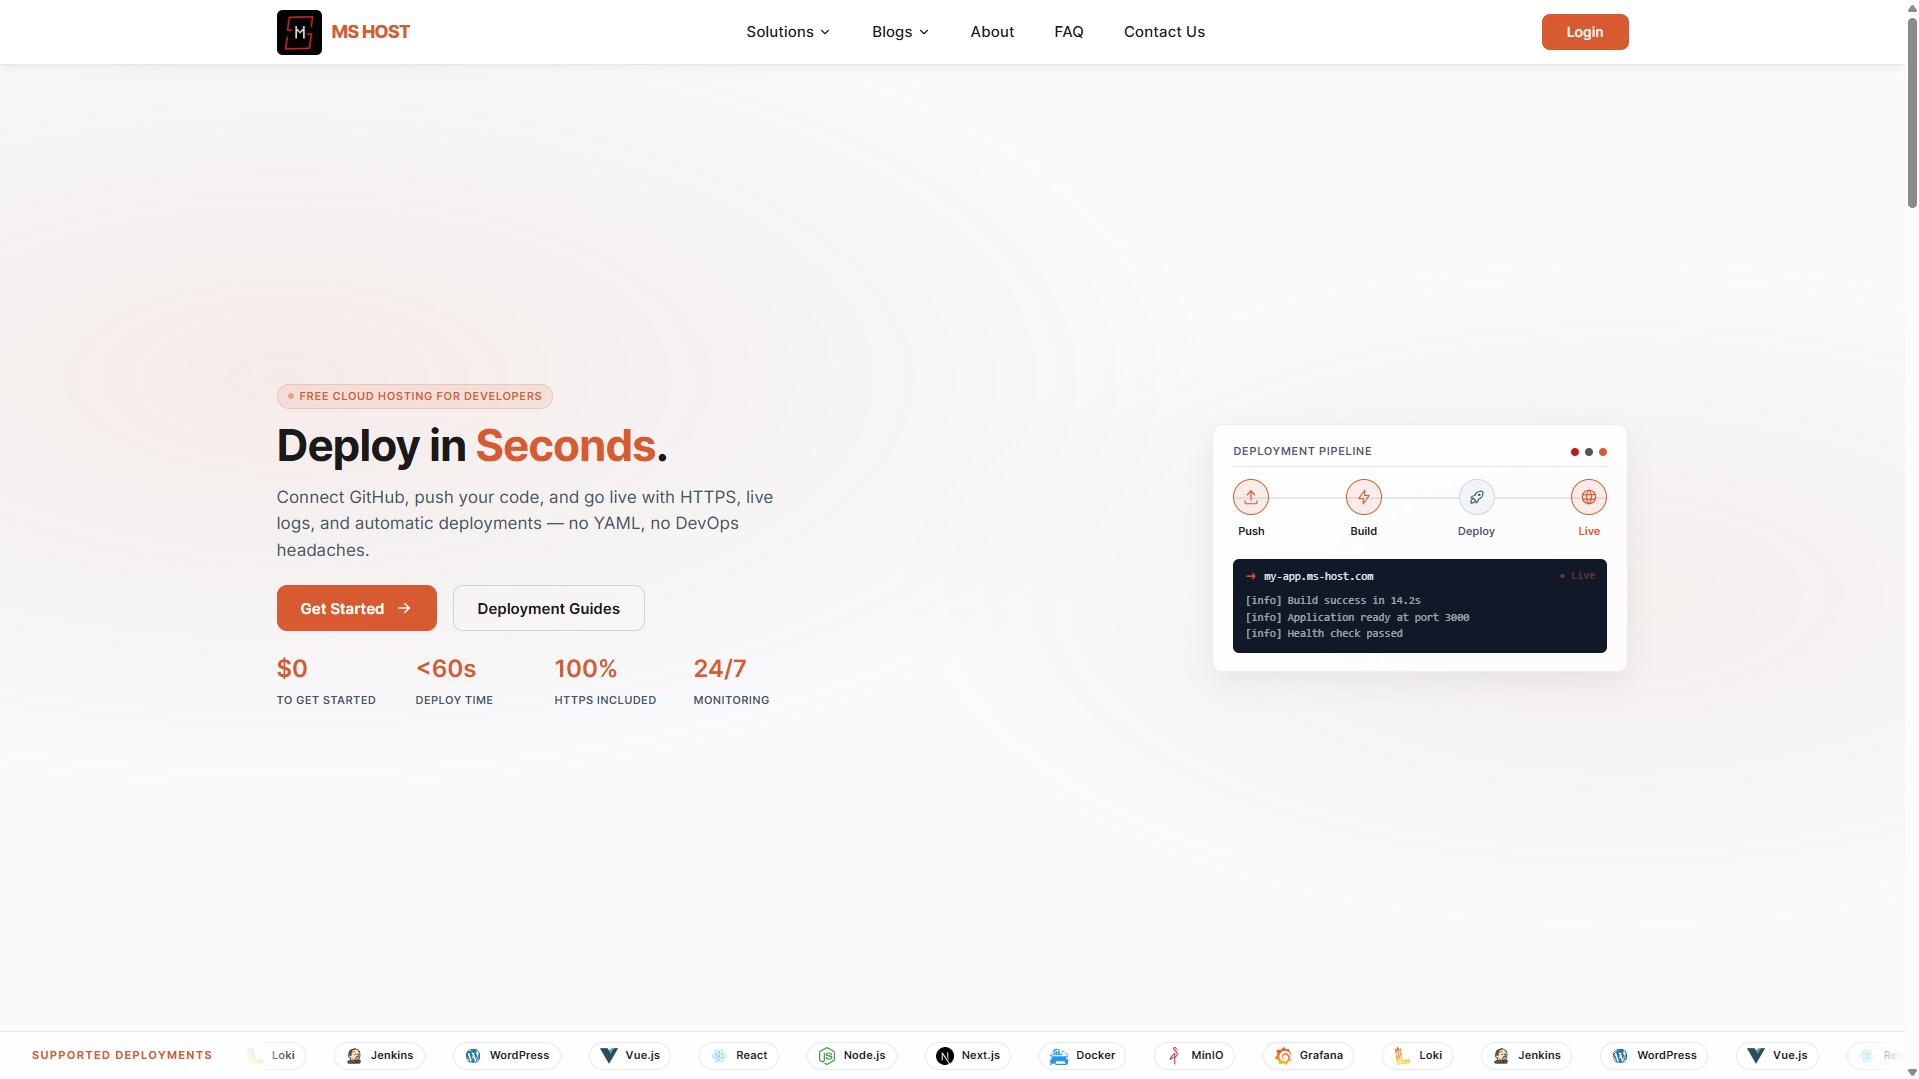
Create your account using:
- Email and password
- Continue with Google
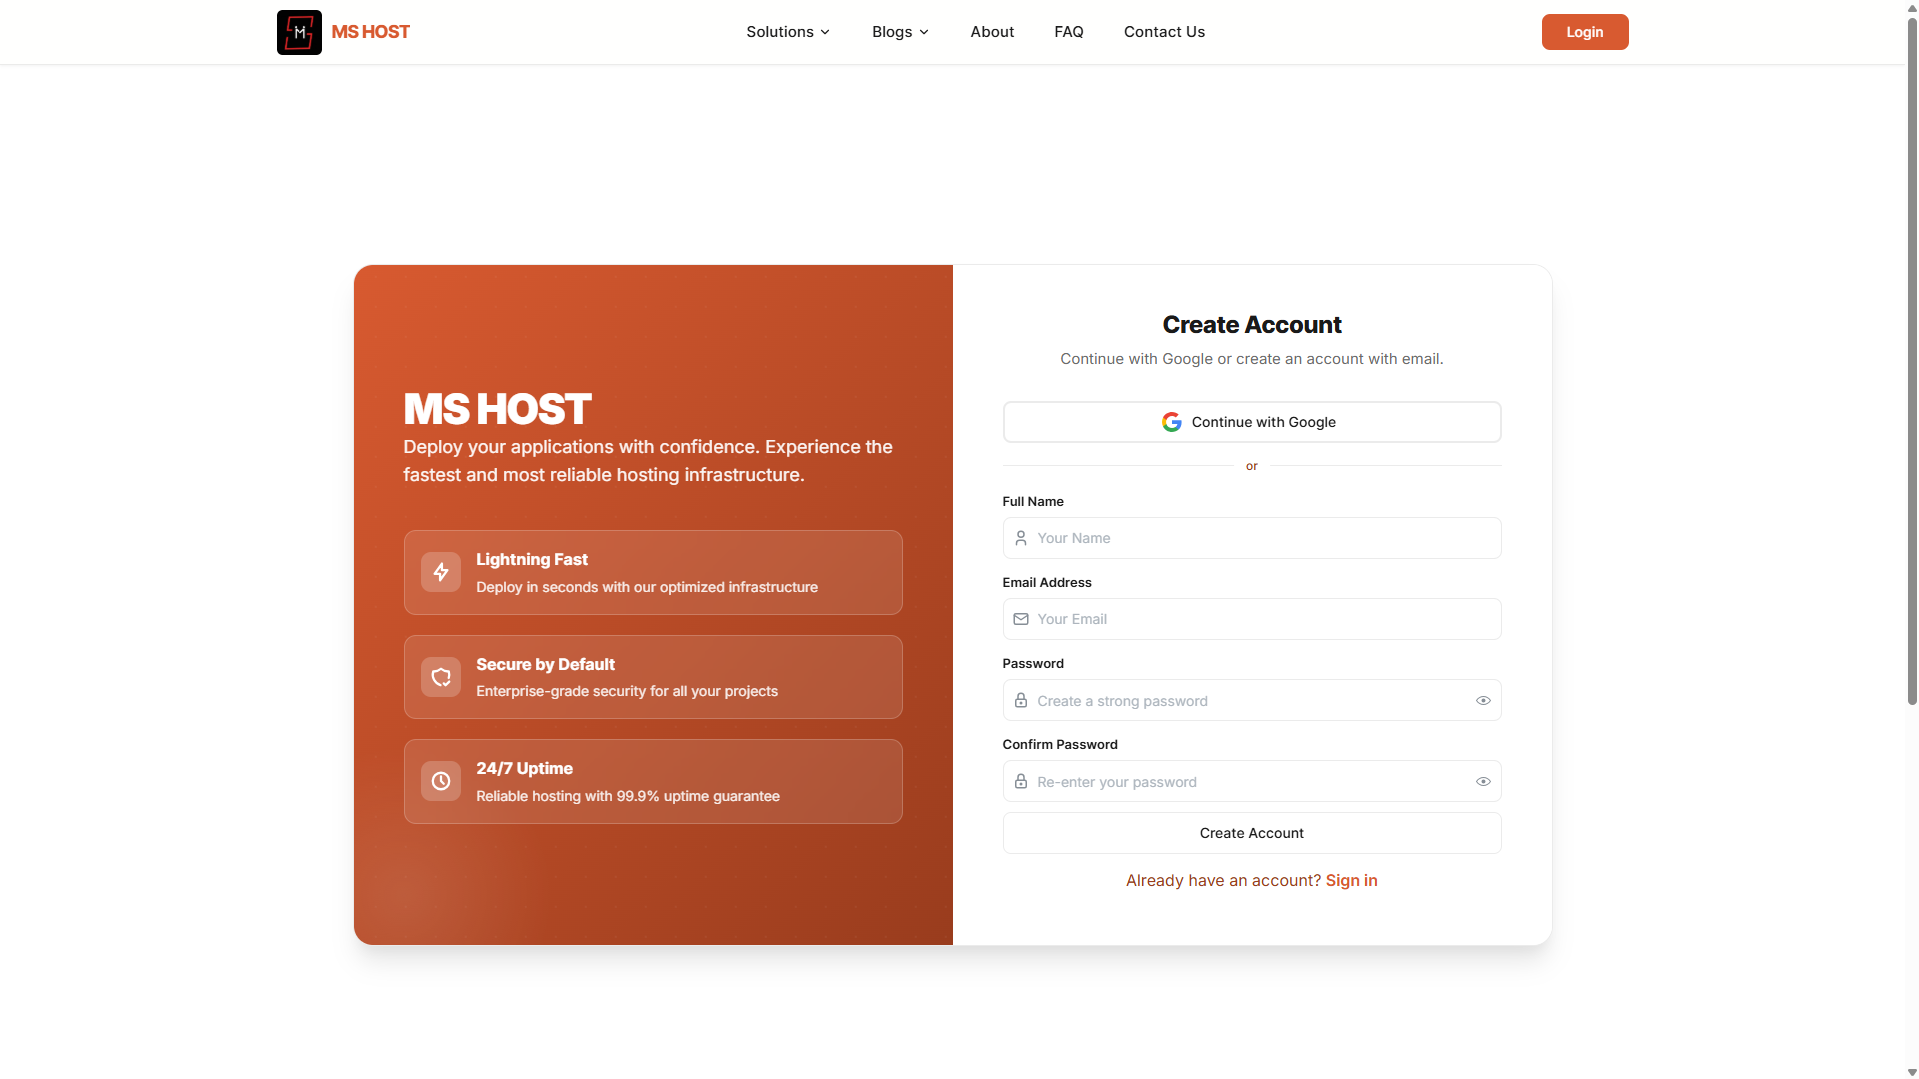
After signing in, you'll be redirected to the MS Host dashboard.
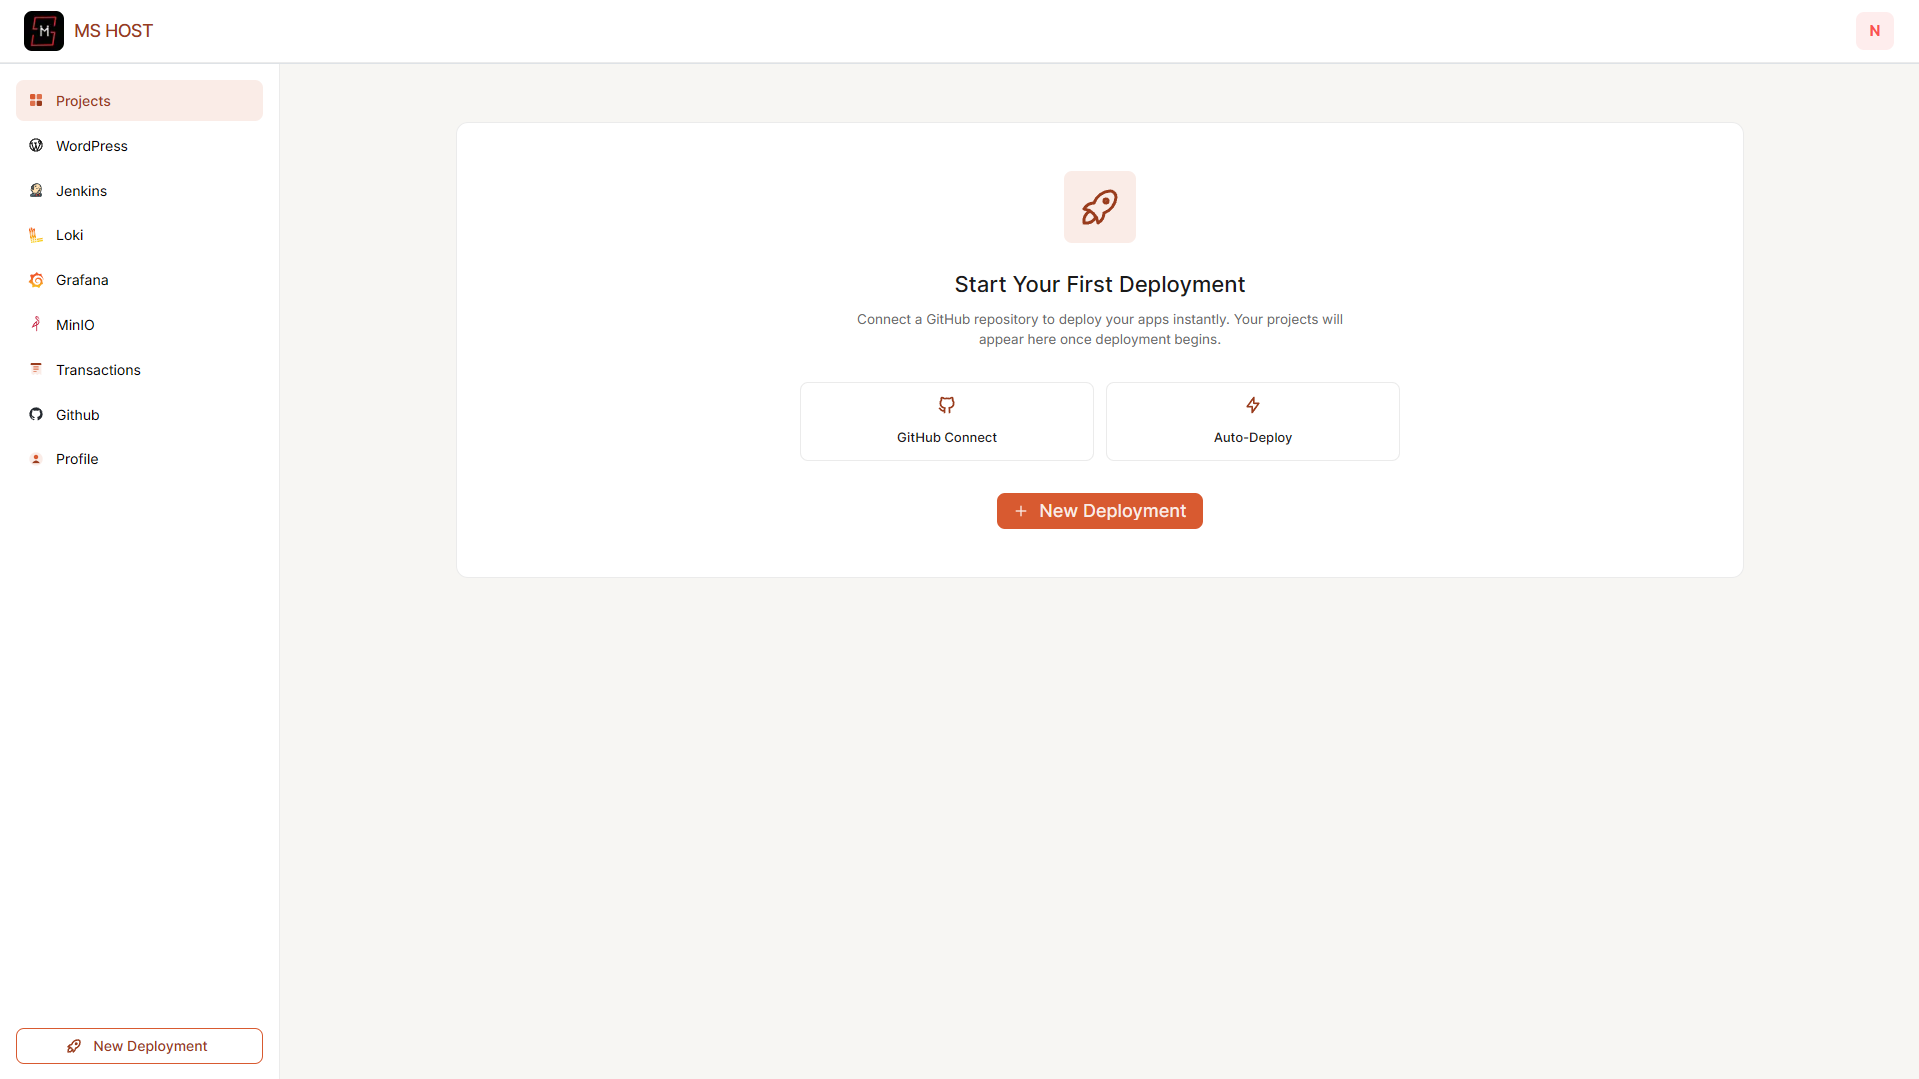
Step 2: GitHub Configuration (Optional)
Inside your dashboard you'll find the GitHub Configuration section.
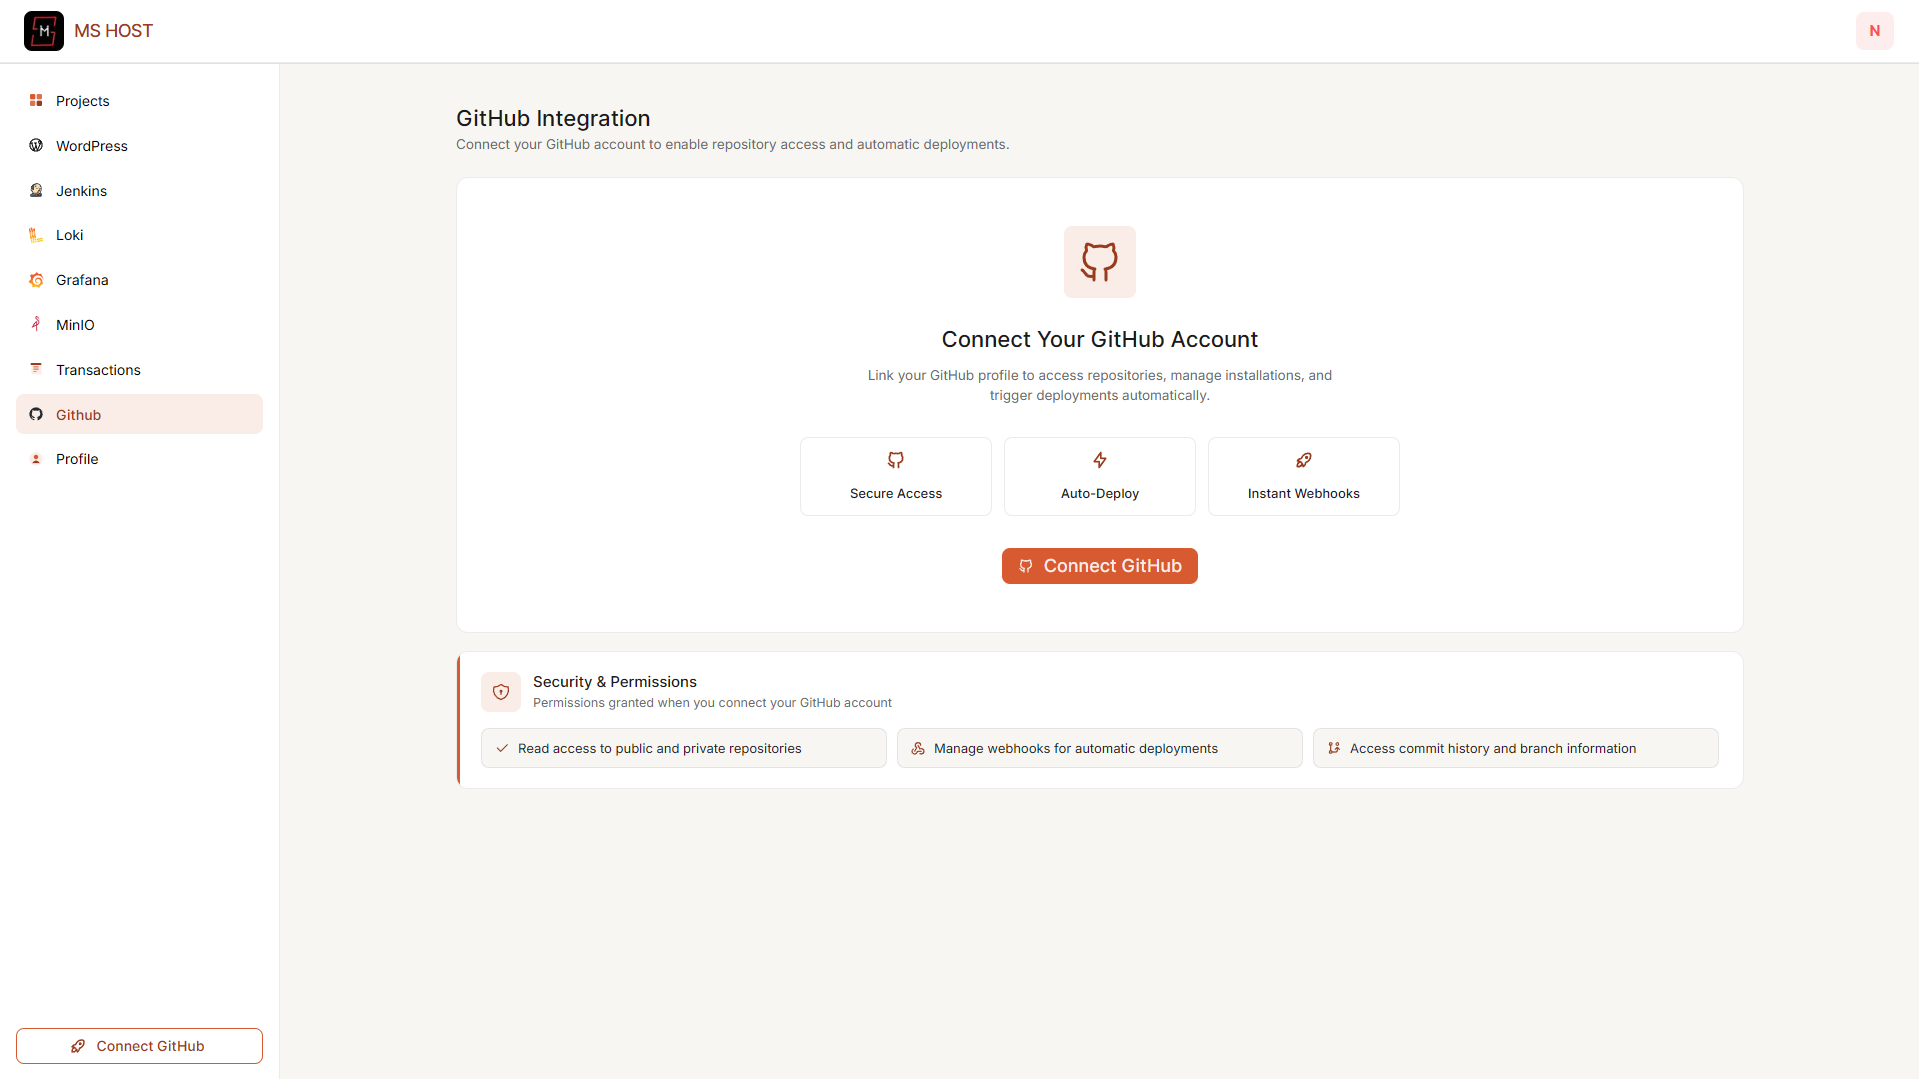
Although Grafana doesn't require a GitHub repository, connecting GitHub allows you to deploy other supported applications from the same dashboard.
Step 3: Open the Grafana Section
From the left sidebar, select:
Grafana
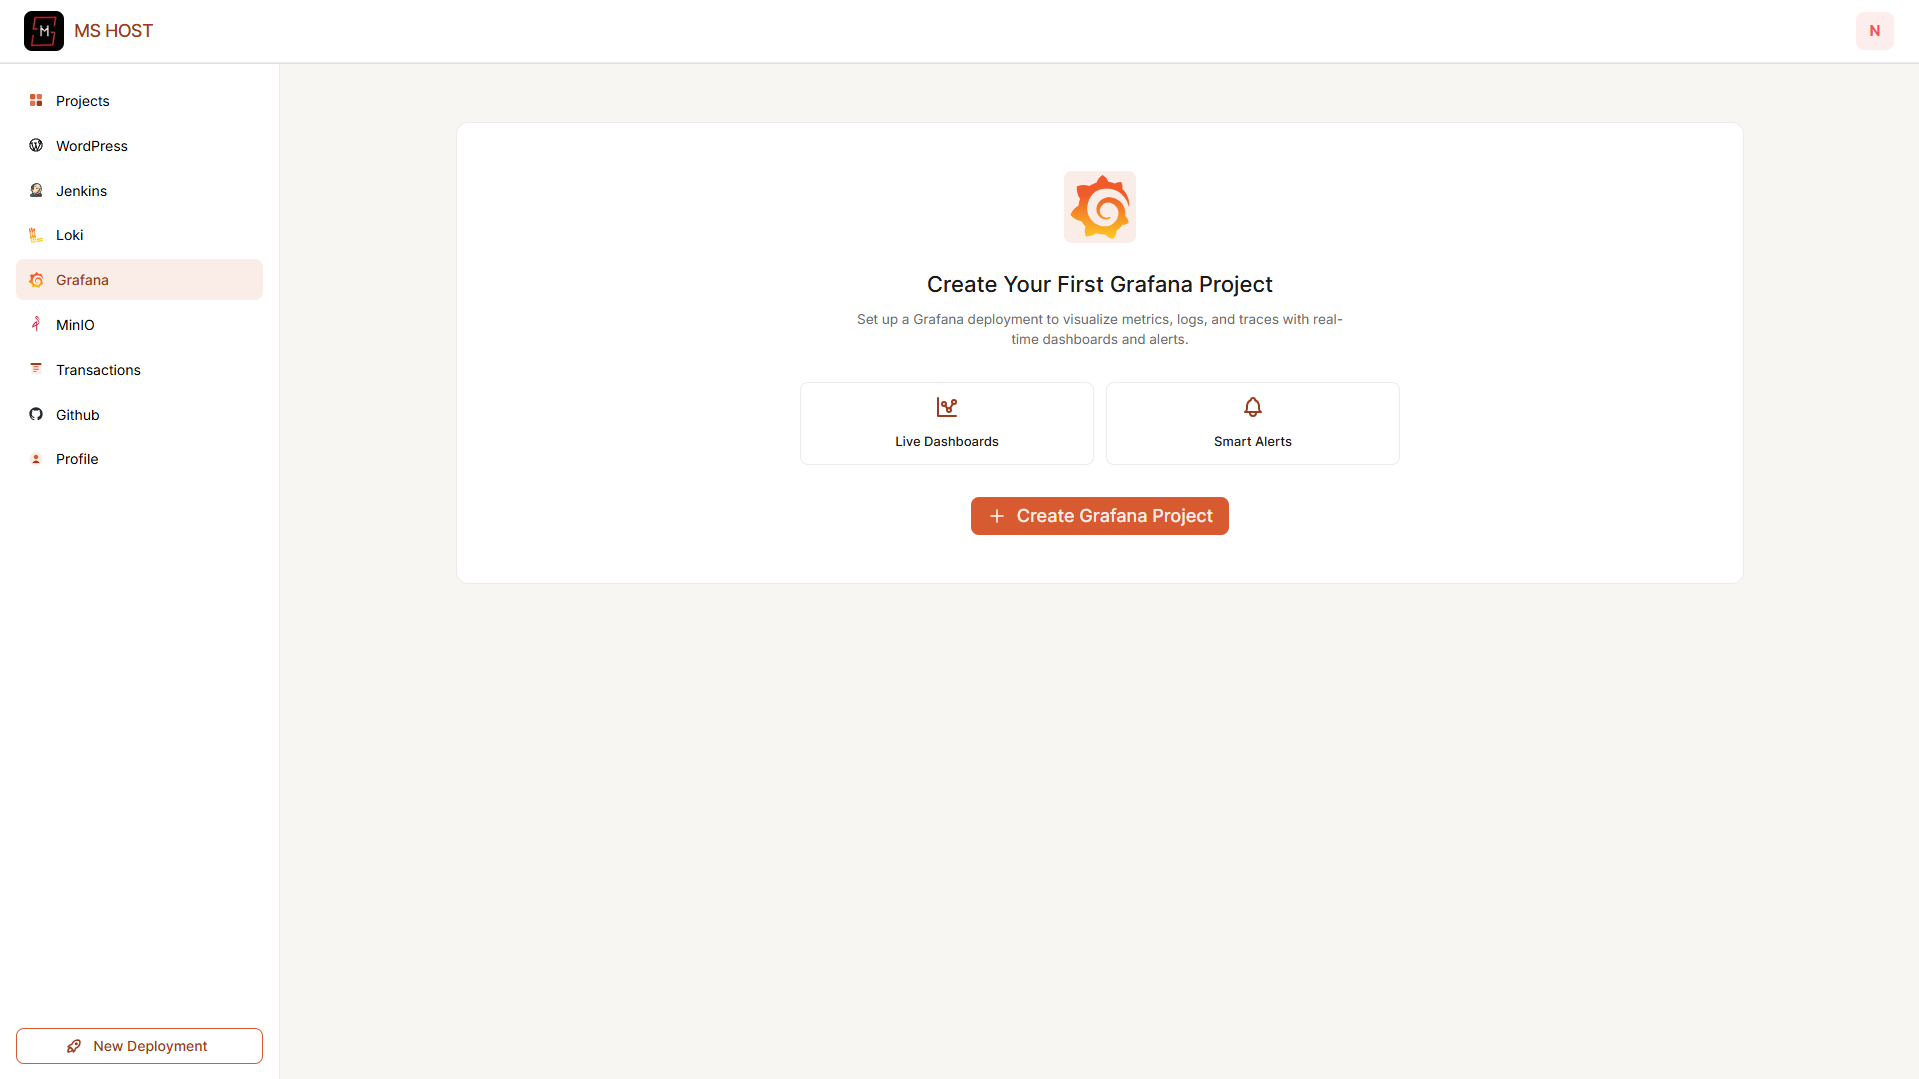
If this is your first deployment, you'll see the following:
Create Your First Grafana Project
Click:
Create Grafana Project
to begin.
Deploy Grafana with MS Host
Step 1: Enter Your Project Name
Choose a memorable name for your Grafana deployment.
Examples:
production-monitoringor
grafana-dashboardThis name helps identify your Grafana instance inside your dashboard.

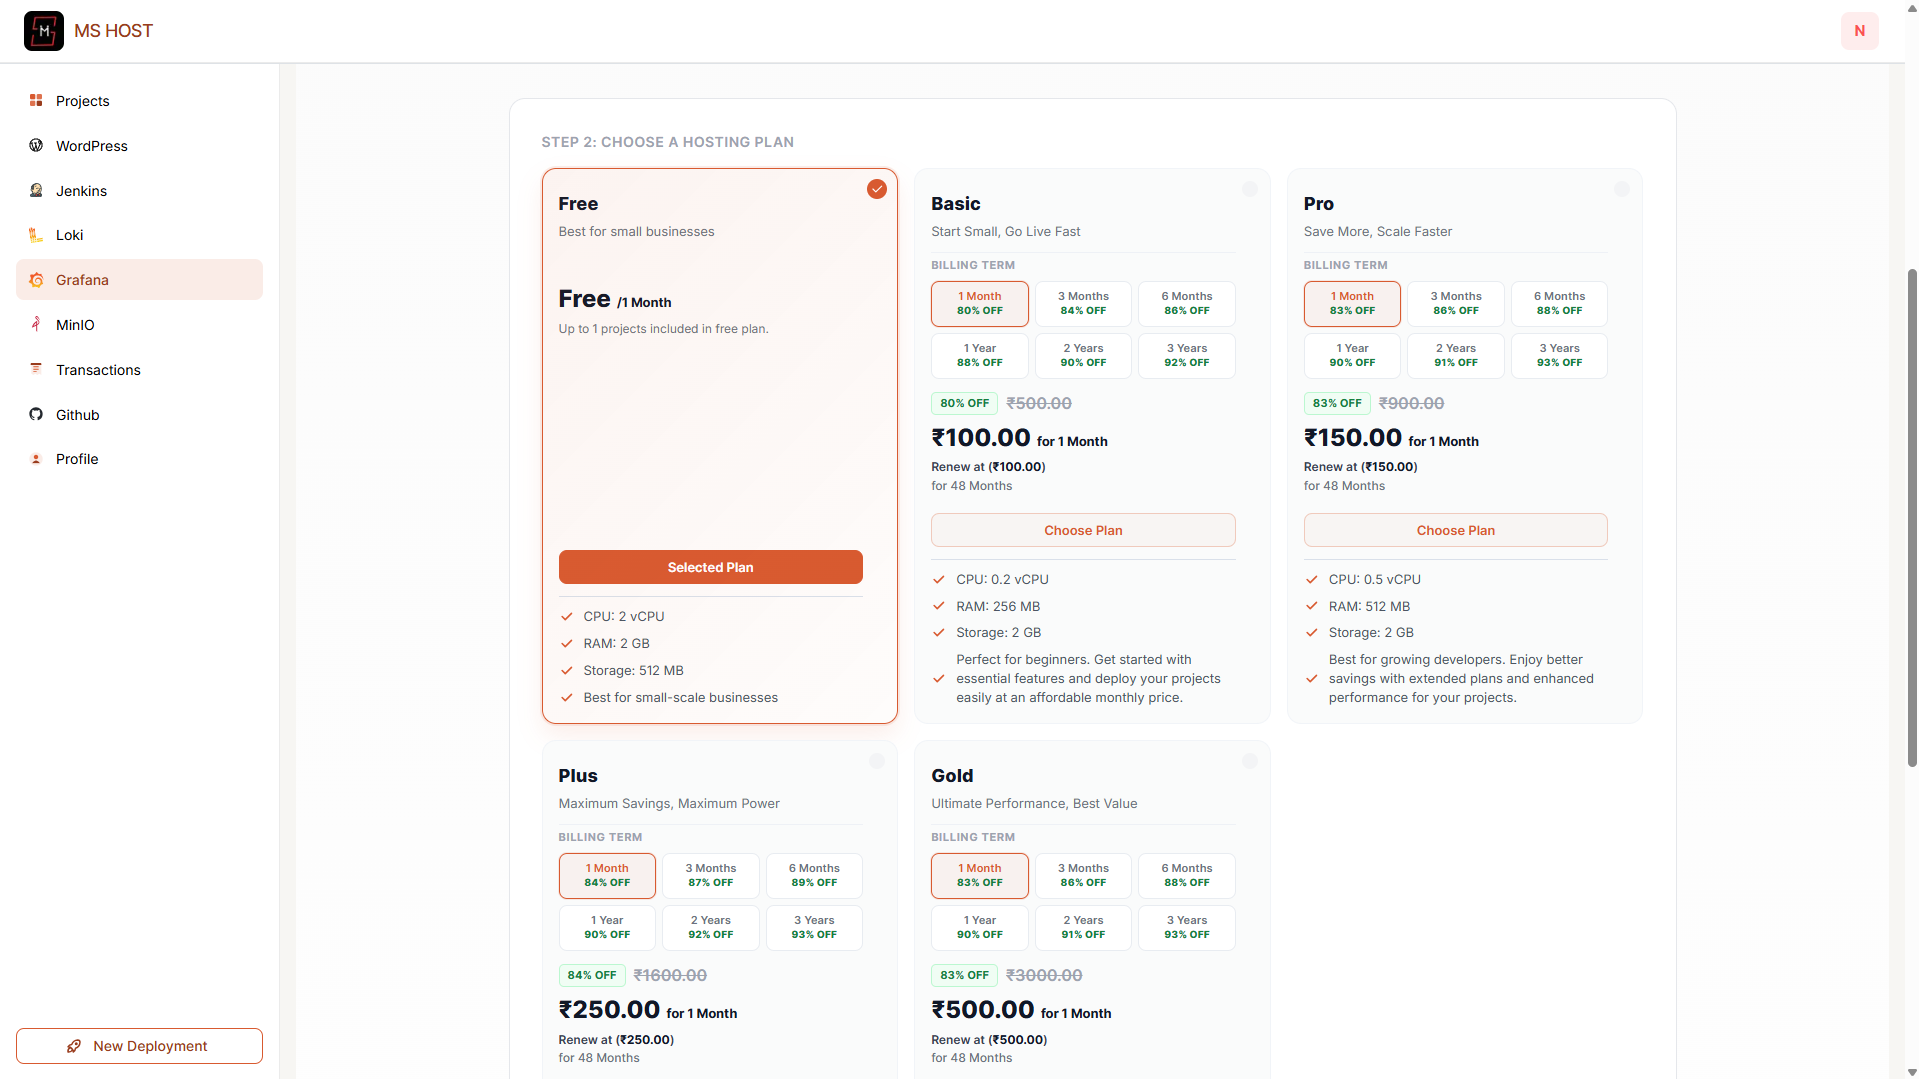
Step 2: Choose a Hosting Plan
Select the hosting plan that best fits your project.
MS Host offers multiple plans depending on your monitoring requirements.
Choose the plan that matches your needs.
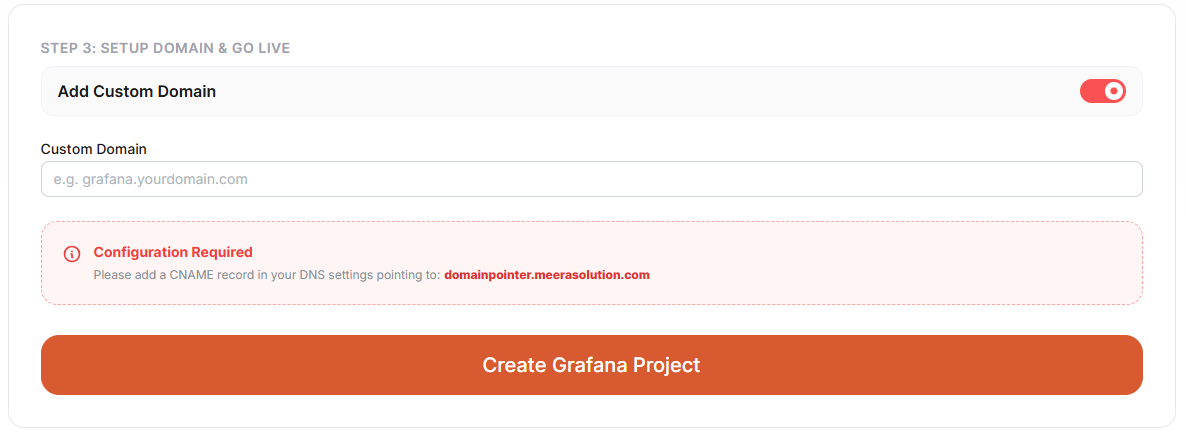
Step 3: Configure a Custom Domain (Optional)
Want to access Grafana using your own domain?
Enable Add Custom Domain.
Example:
grafana.example.comor
monitor.example.comMS Host will provide a CNAME record.
Simply add the provided DNS record to your domain provider.
If you don't have a domain yet, leave this option disabled and continue using the generated deployment URL.
Step 4: Create Your Grafana Project
After reviewing your configuration, click the following:
Create Grafana Project
MS Host will automatically:
- Provision your Grafana instance
- Configure the runtime environment
- Allocate resources
- Deploy Grafana
- Generate deployment logs
Within a few minutes, your monitoring dashboard will be ready.
Monitor Your Deployment
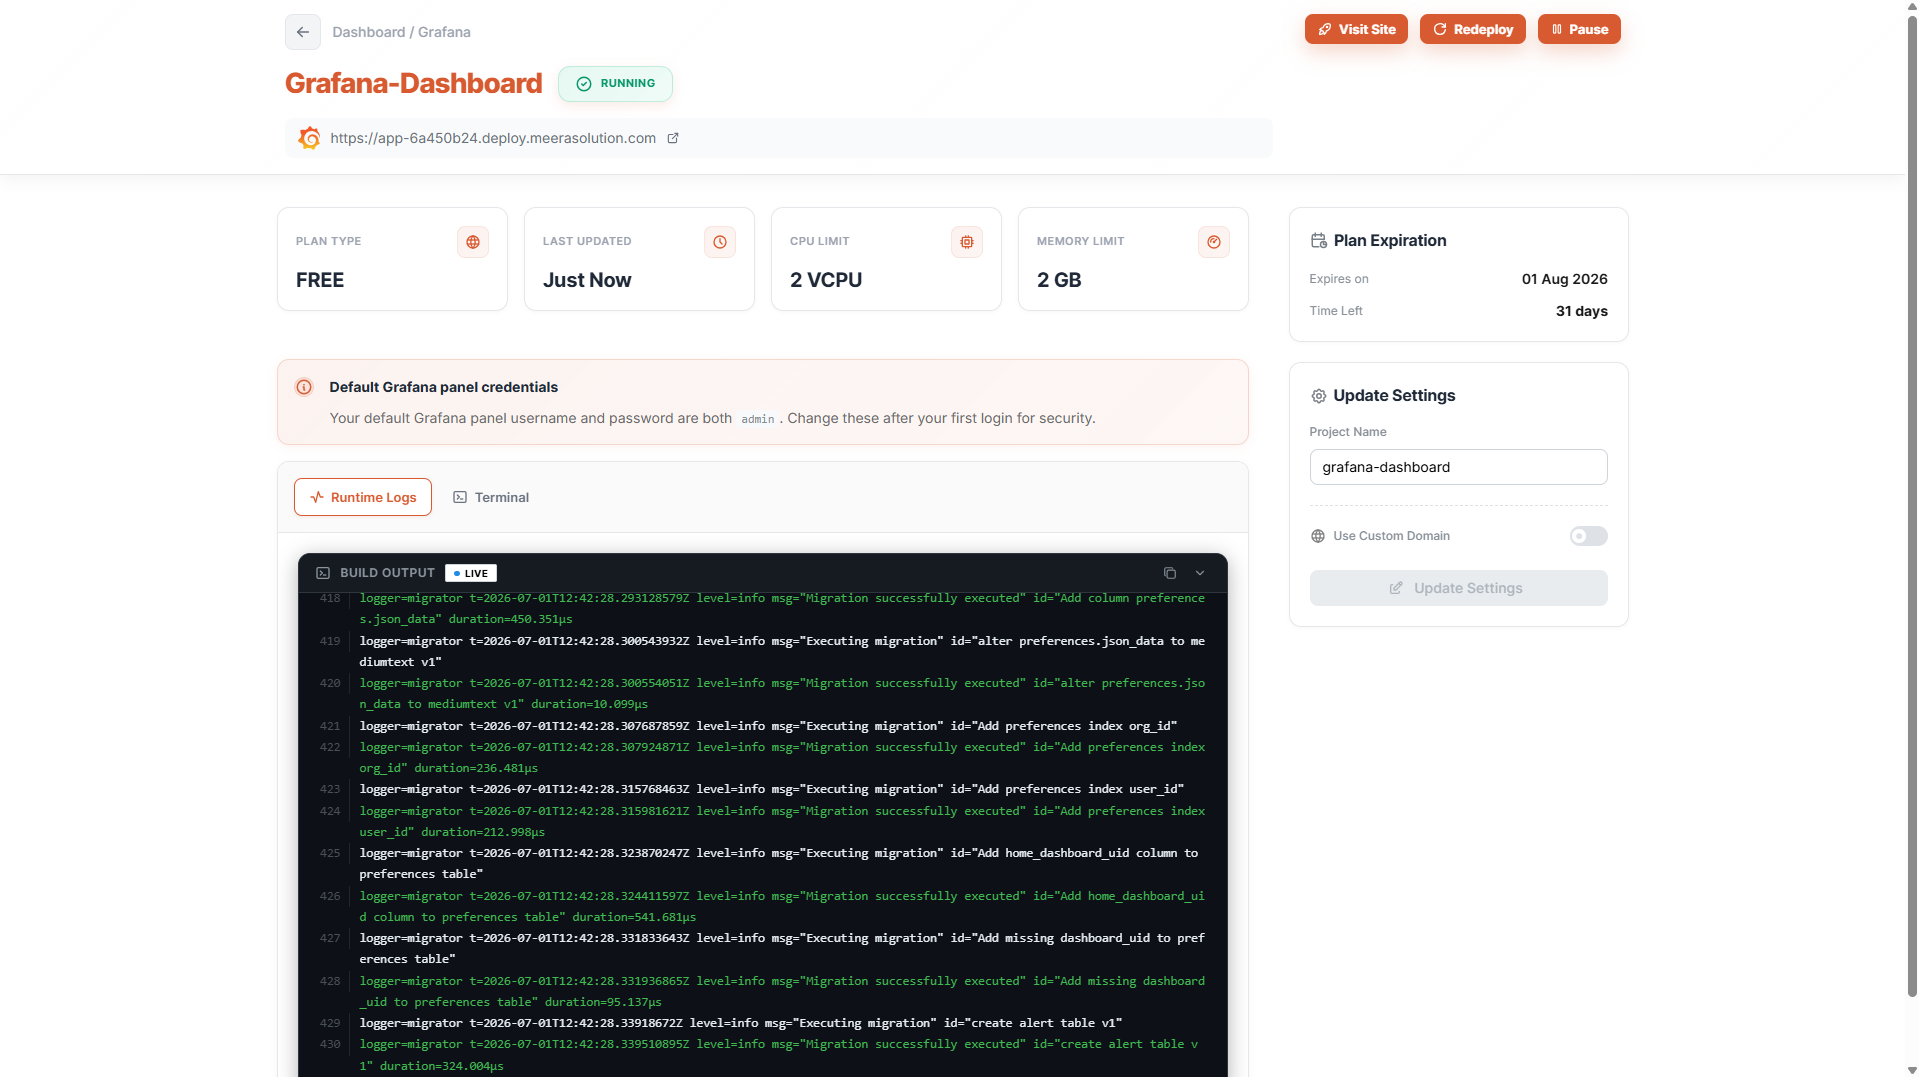
Once deployment begins, you'll be redirected to the Grafana project dashboard.
Here you can monitor your deployment in real time.
The dashboard includes:
- Project Name
- Deployment Status
- Plan Type
- Plan Expiration
- Remaining Time
- CPU Allocation
- Memory Allocation
- Last Updated
- Runtime Logs
- Project Settings
Everything you need to manage Grafana is available from a single dashboard.
Manage Your Grafana Project
After deployment, you can manage your Grafana project without redeploying it.
You can:
- Rename your project
- Configure or update your custom domain
- Monitor resource usage
- View runtime logs
- Track deployment status
MS Host makes ongoing management simple through its centralized dashboard.
Access Your Grafana Dashboard
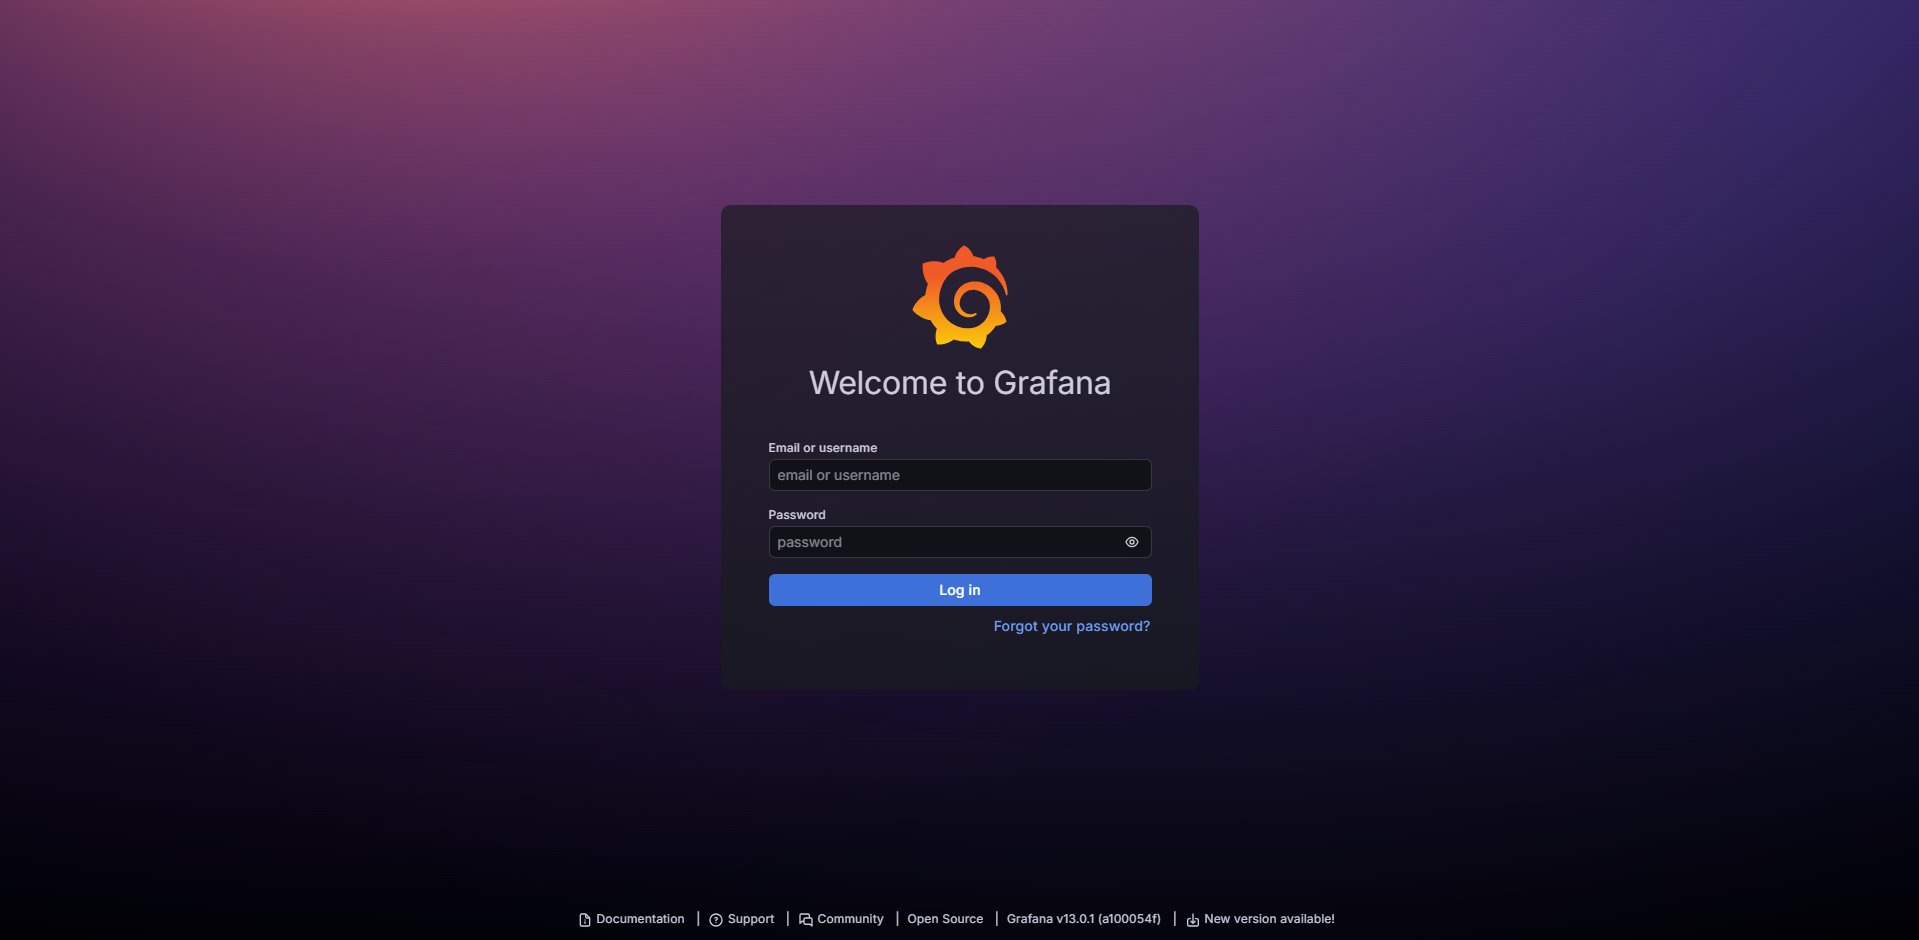
Once deployment is complete, click the generated deployment URL.
You'll be redirected to your Grafana login page, where you can begin configuring data sources, creating dashboards, and monitoring your infrastructure.
What Can You Do with Grafana?
After your Grafana instance is running, you can:
- Build real-time dashboards
- Monitor server performance
- Connect multiple data sources
- Create alert rules
- Visualize infrastructure metrics
- Analyze application performance
- Connect with Loki for centralized log visualization
If you've already deployed Loki using MS Host, Grafana integrates perfectly to provide a complete observability solution.
Final Thoughts
Grafana has become one of the most trusted monitoring and visualization platforms for modern applications and infrastructure.
Whether you're monitoring servers, cloud services, APIs, or application metrics, Grafana provides the insights you need through powerful dashboards.
With MS Host, deploying Grafana is fast, simple, and completely managed.
Create your project, choose a hosting plan, optionally connect your custom domain, and start monitoring your systems in just a few minutes.
Build smarter dashboards. Monitor with confidence. Scale effortlessly. 🚀