How to Setup Grafana Loki Logging in NestJS (Complete Step-by-Step Guide)

Modern backend applications need centralized logging to debug issues, monitor APIs, and analyze production behavior efficiently. Instead of storing logs locally, we can use Grafana + Loki — a lightweight and powerful logging stack.
In this guide, you’ll learn how to:
✅ Install Docker
✅ Setup Grafana & Loki using Docker Compose
✅ Understand ports, username & password configuration
✅ Connect Loki datasource in Grafana
✅ View logs using queries
✅ Integrate Loki logging inside a NestJS application using Winston
🧠 What is Grafana Loki?
Loki is a log aggregation system built by Grafana Labs. Unlike ELK Stack, Loki:
- Stores logs efficiently
- Uses labels instead of heavy indexing
- Consumes less memory
- Perfect for microservices & Node.js apps
Grafana is used to visualize and explore logs.
Step 1 — Install Docker
First, install Docker on your system.
👉 Download Docker Desktop:
https://www.docker.com/products/docker-desktop/
Verify installation:
docker --version
docker compose version
Step 2 — Create docker-compose.yml
Create a file:
docker-compose.yml
Add the following configuration:
version: "3.9"

services:
  loki:
    image: grafana/loki:3.6.0
    container_name: loki
    restart: unless-stopped
    user: root
    ports:
      - "3100:3100"
    volumes:
      - ./loki/loki-config.yaml:/etc/loki/local-config.yaml
      - loki_data:/loki
    command: -config.file=/etc/loki/local-config.yaml
    networks:
      - observability

  grafana:
    image: grafana/grafana:12.4.1
    container_name: grafana
    restart: unless-stopped
    ports:
      - "3200:3000"
    environment:
      GF_SECURITY_ADMIN_USER: admin
      GF_SECURITY_ADMIN_PASSWORD: admin
      GF_USERS_ALLOW_SIGN_UP: "false"
    volumes:
      - grafana_data:/var/lib/grafana
    depends_on:
      - loki
    networks:
      - observability

volumes:
  loki_data:
  grafana_data:

networks:
  observability:
    driver: bridge
🔎 Understanding Ports, Username & Password
📌 Ports Mapping
Format:
HOST_PORT : CONTAINER_PORT
| Service | Mapping | Meaning |
|---|---|---|
| Loki | 3100:3100 | Loki API available at localhost:3100 |
| Grafana | 3200:3000 | Access Grafana using port 3200 |
So:
- Grafana internally runs on 3000
- You access it via http://localhost:3200
📌 Grafana Login Credentials
Defined using environment variables:
GF_SECURITY_ADMIN_USER: admin
GF_SECURITY_ADMIN_PASSWORD: admin
Login credentials:
Username: admin
Password: admin
You can change these anytime.
Step 3 — Create Loki Config File
Create folder:
loki/
Create file:
loki-config.yaml
Add:
auth_enabled: false

server:
  http_listen_port: 3100

common:
  path_prefix: /loki
  storage:
    filesystem:
      chunks_directory: /loki/chunks
      rules_directory: /loki/rules
  replication_factor: 1
  ring:
    kvstore:
      store: inmemory

schema_config:
  configs:
    - from: 2024-01-01
      store: tsdb
      object_store: filesystem
      schema: v13
      index:
        prefix: index_
        period: 24h

limits_config:
  retention_period: 168h # 7 days logs retention
What this config does:
- Runs Loki on port 3100
- Stores logs locally
- Keeps logs for 7 days
- Uses filesystem storage
Step 4 — Run Docker Compose
Start Grafana & Loki:
docker compose up -d
Docker will:
✅ Pull images
✅ Create containers
✅ Setup network
✅ Start services
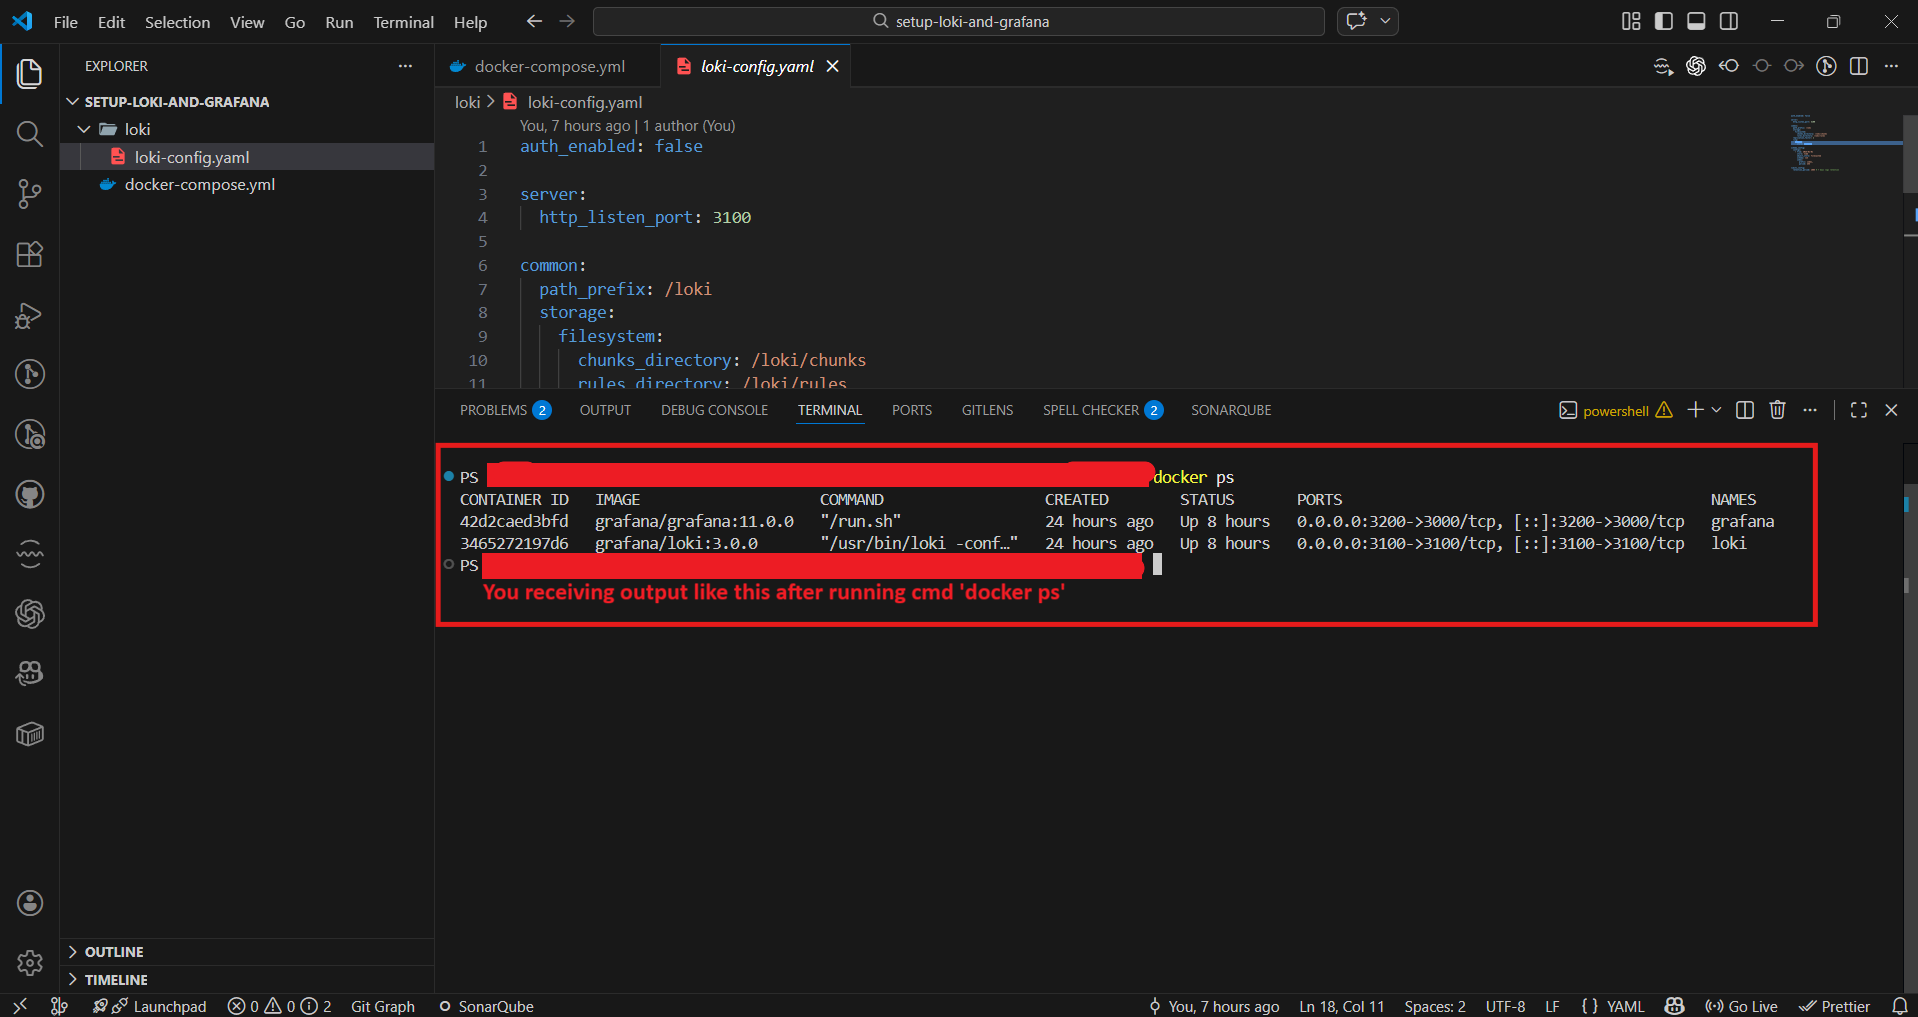
Check running containers:
docker ps
Step 5 — Without Docker (Optional)
If you don’t know Docker, you can install manually:
- Grafana Download:
https://grafana.com/grafana/download - Loki Download:
https://github.com/grafana/loki/releases/
(Download binaries according to your OS.)
Step 6 — Verify Installation
Access Grafana
http://localhost:3200
Login:
admin / admin
Check Loki Health
Open:
http://localhost:3100/ready
If working correctly:
ready
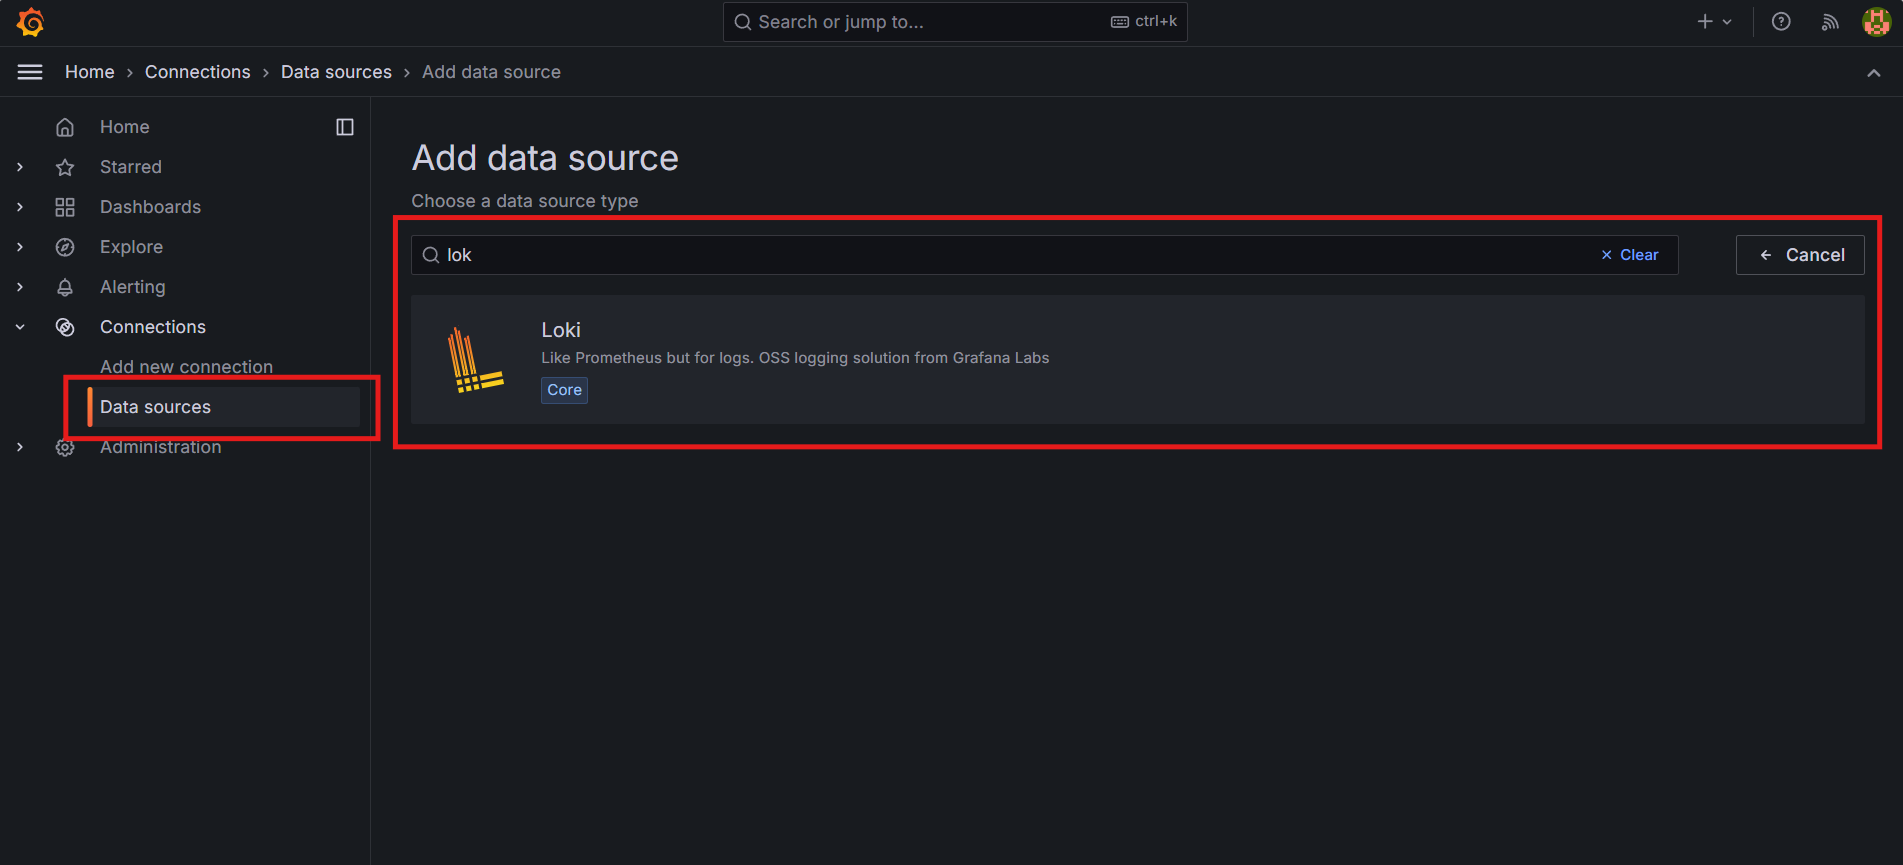
Step 7 — Connect Loki Data Source in Grafana
- Open Grafana
- Go to ⚙️ Settings
- Click Data Sources
- Click Add data source
- Select Loki
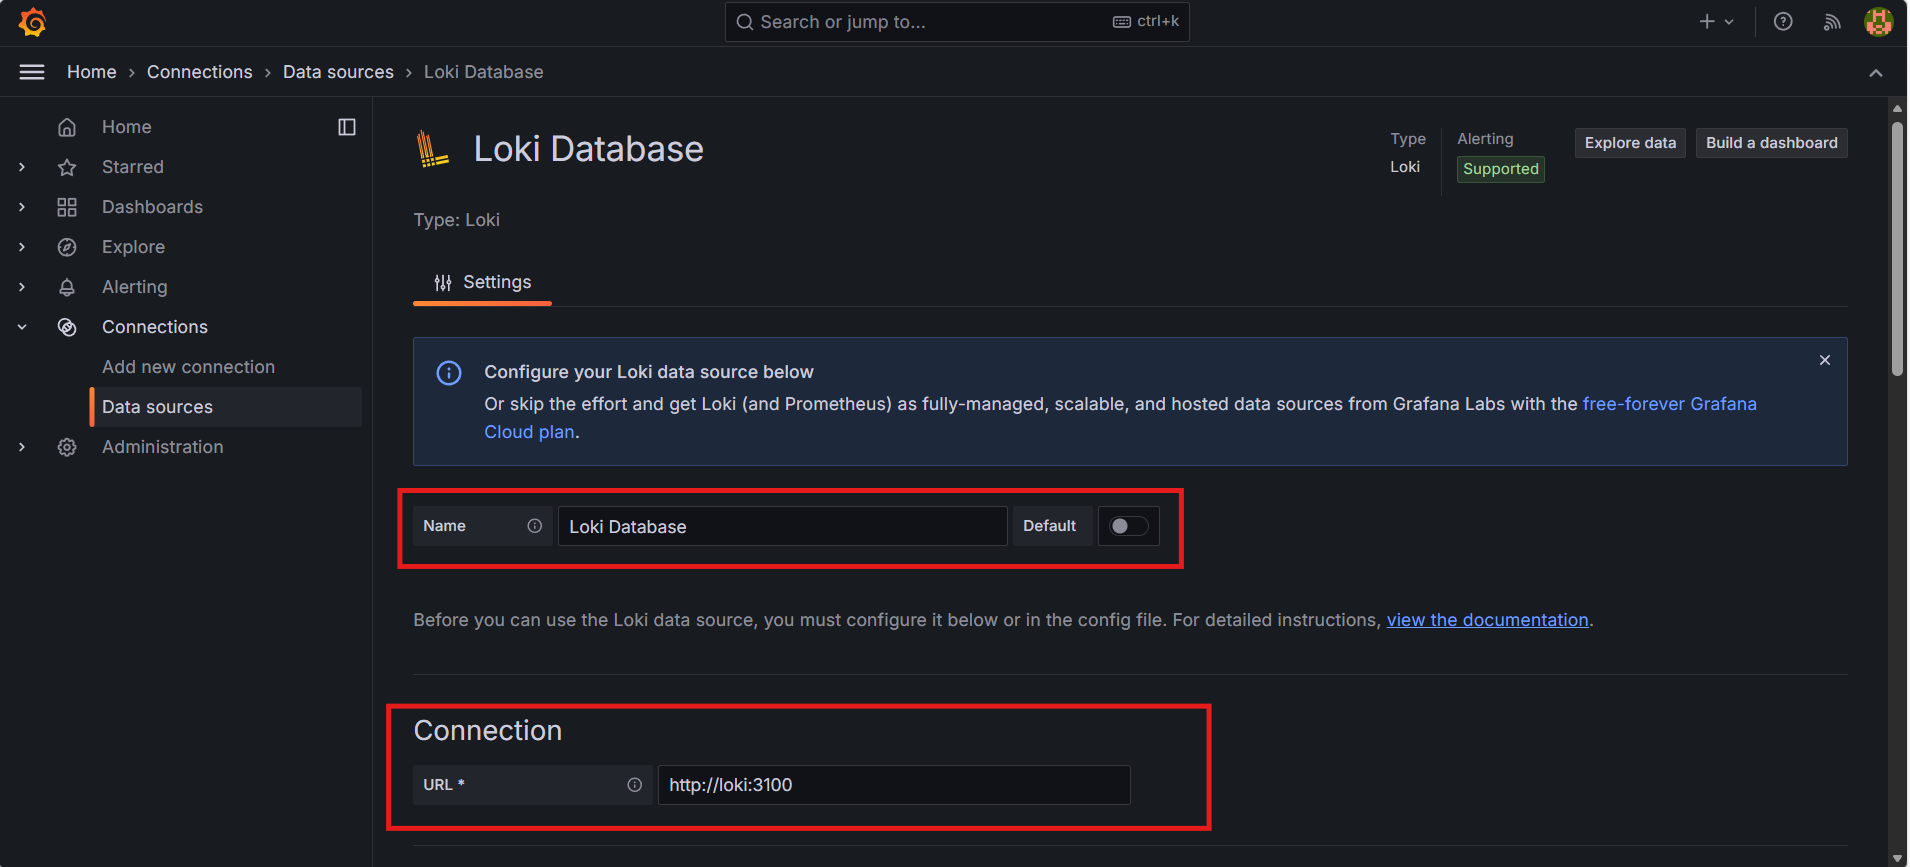
Configure:
URL: http://loki:3100
(Inside Docker network, service name works as hostname.)
Click:
✅ Save & Test
You should see:
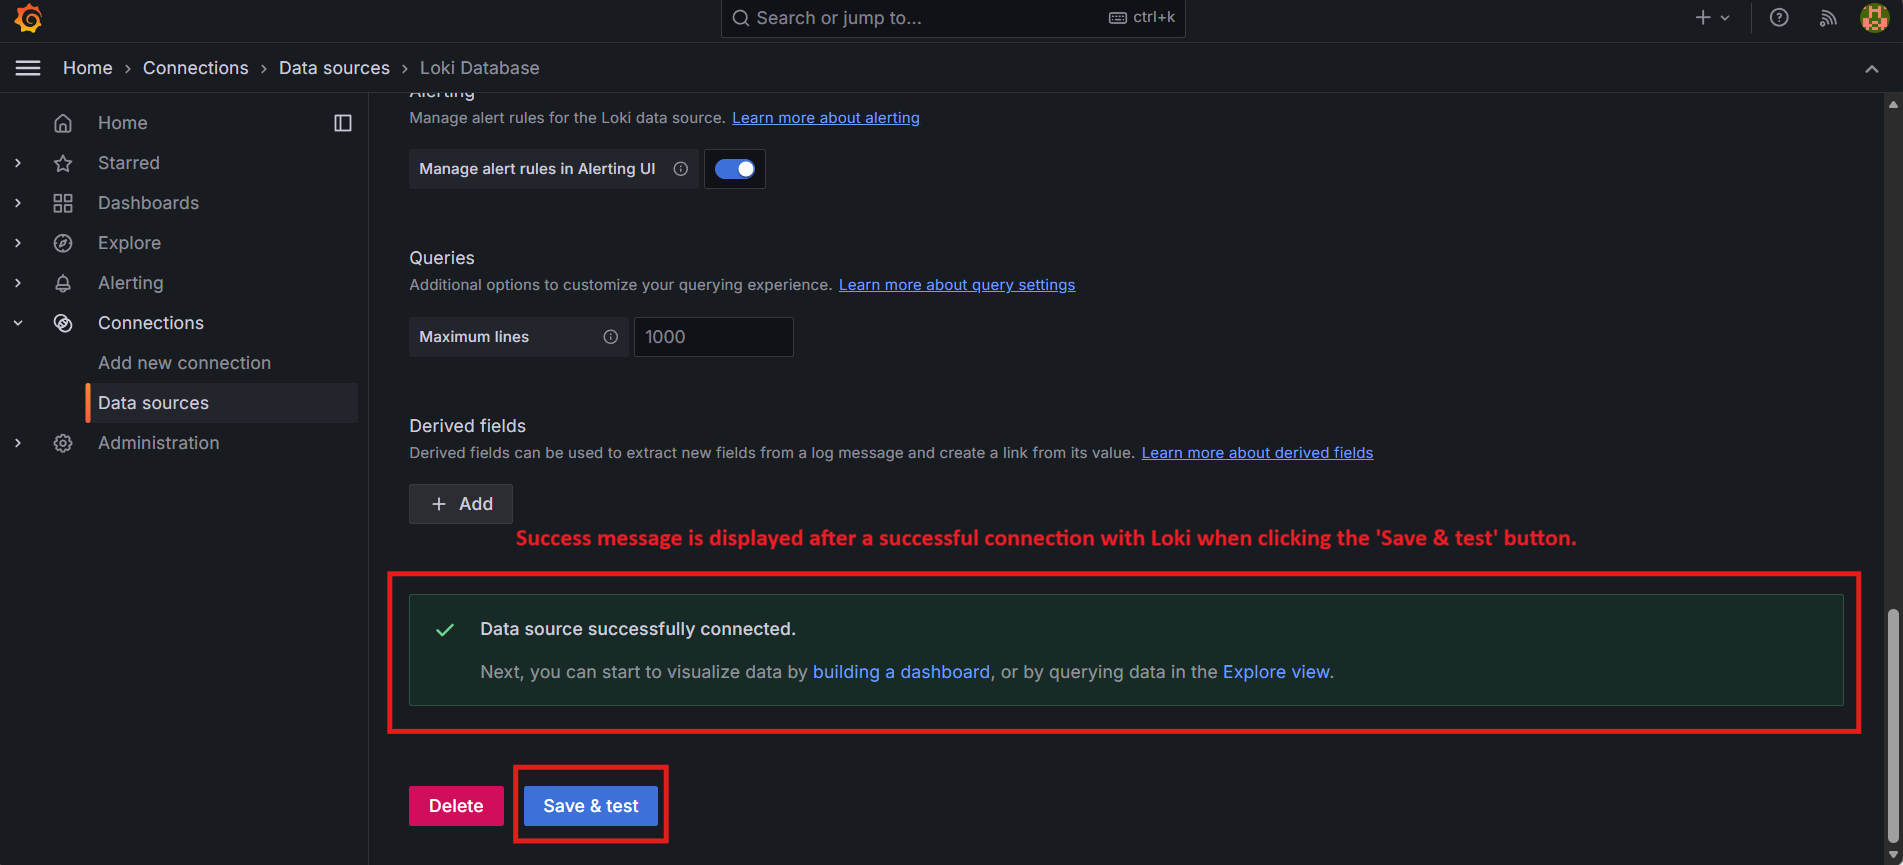
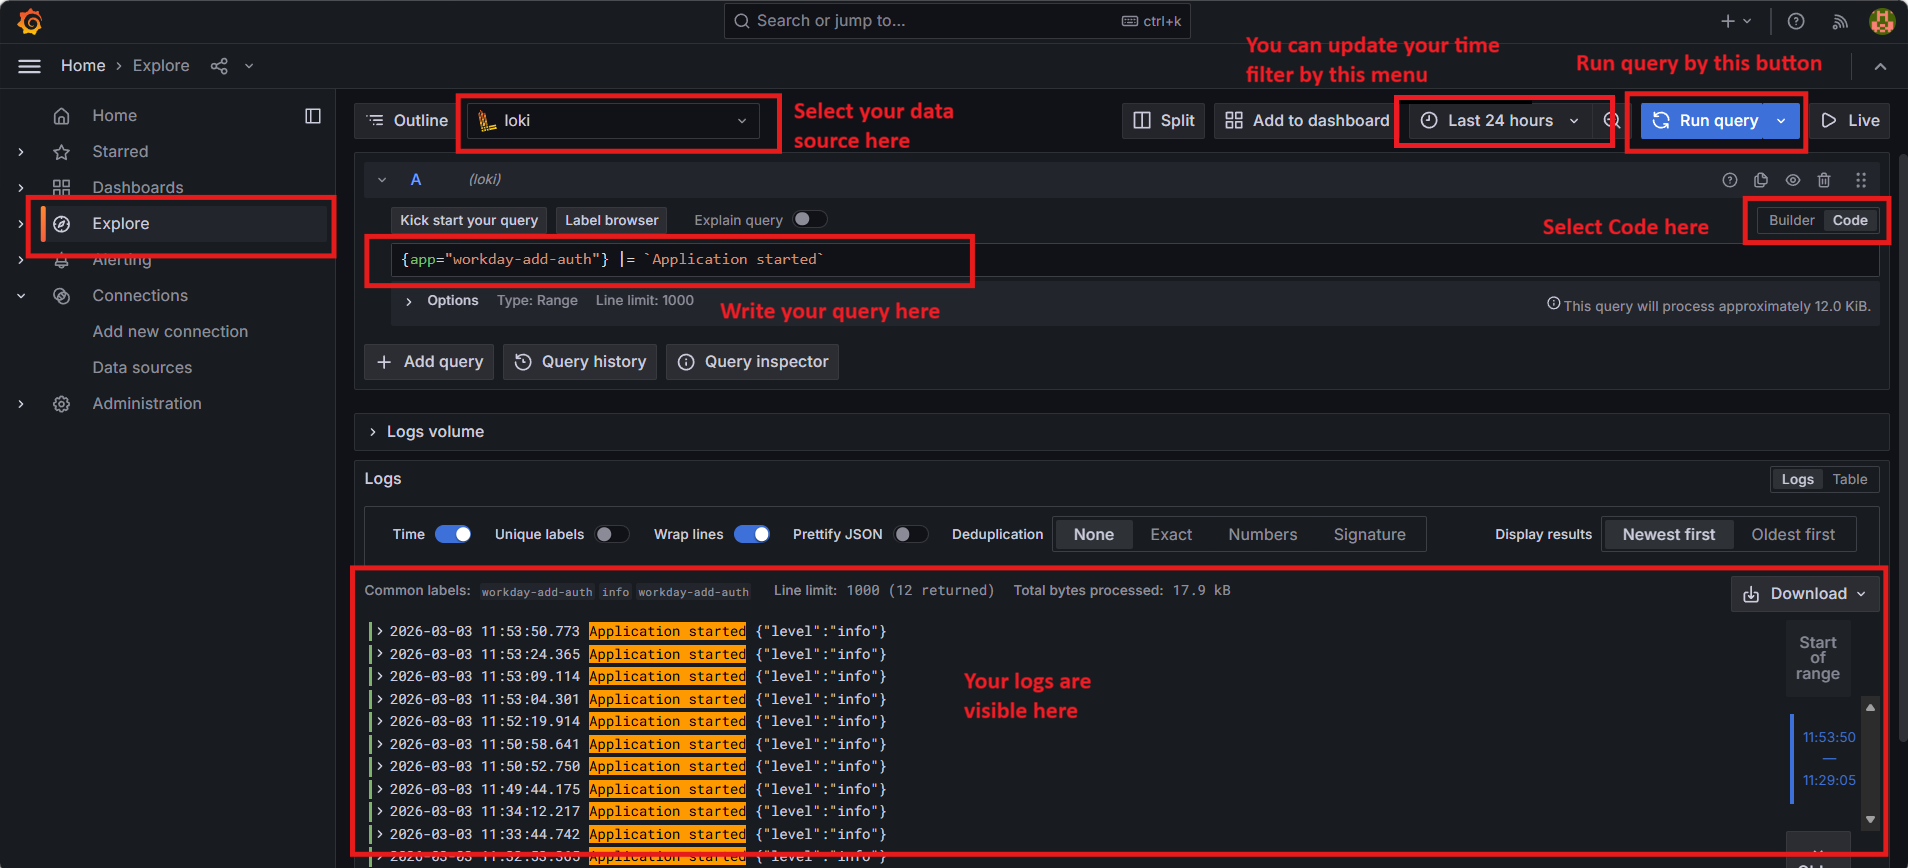
Step 8 — View Logs in Grafana
Go to:
Explore → Select Loki
Sample Query
{app="nestjs-app"}
Filter by log level:
{app="nestjs-app"} |= "error"
Last 5 minutes logs:
{app="nestjs-app"}[5m]
Step 9 — Setup Loki Logging in NestJS
Now we connect NestJS application logs to Loki.
Install Dependencies
npm install winston winston-loki
Create loki.logger.ts
import winston from 'winston';
import LokiTransport from 'winston-loki';
export const lokiLogger = winston.createLogger({
level: 'debug',
format: winston.format.json(),
transports: [
new LokiTransport({
host: `http://localhost:3100`,
labels: { app: 'nestjs-app' },
json: true,
batching: false,
replaceTimestamp: true,
onConnectionError: (err) =>
console.error('Loki connection error:', err),
}),
new winston.transports.Console(),
],
});
Create Logs Example
lokiLogger.log({
level: 'info',
message: `Your Message`,
api: 'Your Api Name',
});
Log Levels Supported:
debug | info | warn | error
✅ How Logging Flow Works
NestJS App
↓
Winston Logger
↓
Loki Transport
↓
Loki Server
↓
Grafana Explore UI
🎯 Benefits of Using Grafana + Loki
✅ Lightweight compared to ELK
✅ Easy Docker setup
✅ Fast log querying
✅ Label-based filtering
✅ Perfect for Node.js microservices
✅ Production ready
✅ Final Result
You now have:
- Grafana dashboard running
- Loki log aggregation
- NestJS centralized logging
- Real-time log visualization
⭐ Conclusion
Using Grafana + Loki with NestJS provides a modern, scalable, and efficient logging solution without the heavy infrastructure required by traditional logging stacks.
This setup works perfectly for:
- Local development
- Staging environments
- Production deployments